
Exhibit 99.1
Management’s Discussion and Analysis
This management’s discussion and analysis is designed to provide you with a narrative explanation through the eyes of our management of how we performed, as well as information about our financial condition and future prospects. We recommend that you read this in conjunction with our consolidated interim financial statements for the three months ended March 31, 2018, our 2017 annual consolidated financial statements and our 2017 annual management’s discussion and analysis. This management’s discussion and analysis contains forward-looking statements, which are subject to risks and uncertainties that could cause our actual results to differ materially from the forward-looking statements. Forward-looking statements include, but are not limited to, our 2018 outlook, statements regarding our proposed Financial & Risk strategic partnership and our expectations related to general economic conditions and market trends and their anticipated effects on our business segments. For additional information related to forward-looking statements and material risks associated with them, please see the “Outlook” and “Additional Information – Cautionary Note Concerning Factors That May Affect Future Results” sections of this management’s discussion and analysis. This management’s discussion and analysis is dated as of May 10, 2018.
We have organized our management’s discussion and analysis in the following key sections:
| ● | Executive Summary – a brief overview of our business, a summary of the proposed Financial & Risk strategic partnership and key financial highlights | 2 | ||||
| ● | Results of Operations – a comparison of our current and prior-year period results | 7 | ||||
| ● | Liquidity and Capital Resources – a discussion of our cash flow and debt | 14 | ||||
| ● | Outlook – our current financial outlook for 2018 | 19 | ||||
| ● | Related Party Transactions – a discussion of transactions with our principal and controlling shareholder, The Woodbridge Company Limited (Woodbridge), and others | 20 | ||||
| ● | Subsequent Events – a discussion of material events occurring after March 31, 2018 and through the date of this management’s discussion and analysis | 20 | ||||
| ● | Changes in Accounting Policies – a discussion of changes in our accounting policies and recent accounting pronouncements | 20 | ||||
| ● | Critical Accounting Estimates and Judgments – a discussion of critical estimates and judgments made by our management in applying accounting policies | 20 | ||||
| ● | Additional Information – other required disclosures | 21 | ||||
| ● | Appendix – supplemental information and discussion | 23 | ||||
Unless otherwise indicated or the context otherwise requires, references in this discussion to “we,” “our,” “us” and “Thomson Reuters” are to Thomson Reuters Corporation and our subsidiaries.
Basis of presentation
We prepare our consolidated financial statements in U.S. dollars in accordance with International Financial Reporting Standards (IFRS), as issued by the International Accounting Standards Board (IASB).
In this management’s discussion and analysis, we discuss our results from continuing operations on both an IFRS and non-IFRS basis. Both bases, except for cash flow, exclude the results of our Financial & Risk business, which was reported as a discontinued operation. Both bases include the results of acquired businesses from the date of purchase for all metrics.
Use of non-IFRS financial measures
We use non-IFRS measures as supplemental indicators of our operating performance and financial position as well as for internal planning purposes and our 2018 business outlook. We believe non-IFRS financial measures provide more insight into our performance. Non-IFRS measures do not have standardized meanings prescribed by IFRS and therefore are unlikely to be comparable to the calculation of similar measures used by other companies, and should not be viewed as alternatives to measures of financial performance calculated in accordance with IFRS.
Page 1
Our non-IFRS financial measures include:
| ● | Adjusted EBITDA and the related margin; |
| ● | Adjusted EBITDA less capital expenditures and the related margin; |
| ● | Adjusted earnings and adjusted earnings per share (EPS); |
| ● | Net debt; and |
| ● | Free cash flow. |
We also report changes in our revenues, operating expenses, adjusted EBITDA and related margin, and adjusted EPS before the impact of foreign currency or at “constant currency”. These measures remove the impacts from changes in foreign currency exchange rates in order to provide better comparability of our business trends from period to period.
See Appendix A of this management’s discussion and analysis for a description of our non-IFRS financial measures, including an explanation of why we believe they are useful measures of our performance, including our ability to generate cash flow. Refer to sections of this management’s discussion and analysis entitled “Results of Operations-Continuing Operations”, “Liquidity and Capital Resources” and Appendix B for reconciliations of our non-IFRS financial measures to the most directly comparable IFRS measures.
Glossary of key terms
We use the following terms in this management’s discussion and analysis.
| Term |
Definition | |
|
bp |
Basis points—one basis point is equal to 1/100th of 1%;“100bp” is equivalent to 1% | |
|
constant currency |
A measure derived by applying the same foreign currency exchange rates to the financial results of the current and equivalent prior-year period | |
|
n/a |
Not applicable | |
|
n/m |
Not meaningful | |
|
organic or organically |
Our existing businesses | |
|
$ and US$ |
U.S. dollars |
Our company
We are a leading source of news and information for professional markets. Our customers rely on us to deliver the intelligence, technology and expertise they need to find trusted answers.
We live at a time when the amount of data is overwhelming, the regulatory environment is complex, markets move at breakneck speed and connectivity is expanding around the world. Our customers count on the accuracy of our information, the reliability of our systems and the relevance of our insights to help them navigate the changing worlds of commerce and regulation. We believe our workflow solutions make our customers more productive, by streamlining how they operate. Reuters is renowned for the integrity of its news. The principles of freedom from bias and access to information govern everything that we do.
We derive the majority of our revenues from selling solutions to our customers, primarily electronically and on a subscription basis. Many of our customers utilize our solutions as part of their workflows. We believe this is a significant competitive advantage as it has led to strong customer retention. Over the years, our business model has proven to be capital efficient and cash flow generative, and it has enabled us to maintain leading and scalable positions in our chosen market segments.
Page 2
|
Our continuing business is organized as three reportable segments supported by a corporate center:
|
First Quarter 2018 Revenues
| |||
|
|
Legal A provider of critical online and print information, decision tools, software and services that support legal, investigation, business and government professionals around the world.
|
|||
|
|
Tax & Accounting A provider of integrated tax compliance and accounting information, software and services for professionals in accounting firms, corporations, law firms and government.
|
|||
|
|
Reuters News A provider of real-time, multimedia news and information services to newspapers, television and cable networks, radio stations and websites around the globe, as well as to our Financial & Risk business, which is classified as a discontinued operation (see the “Proposed Financial & Risk Strategic Partnership Transaction” section).
|
|||


We also operate:
| ● | A Global Growth Organization (GGO) that works across our business units to combine our global capabilities and to expand our local presence and development in countries and regions where we believe the greatest growth opportunities exist. GGO supports our businesses in: Latin America, China, India, the Middle East, Africa, the Association of Southeast Asian Nations, North Asia, Russia and countries comprising the Commonwealth of Independent States and Turkey. We include the results of GGO within our reportable segments. |
| ● | An Enterprise Technology & Operations (ET&O) group that drives the transformation of our company into a more integrated enterprise by unifying infrastructure across our organization, including technology platforms, data centers, real estate, products and services. |
Proposed Financial & Risk Strategic Partnership Transaction
On January 30, 2018, we signed a definitive agreement to enter into a strategic partnership with private equity funds managed by Blackstone. Canada Pension Plan Investment Board and an affiliate of GIC will invest alongside Blackstone. As part of the transaction, we will sell a 55% majority stake in our Financial & Risk business and will retain a 45% interest in the business.
We will maintain full ownership of our Legal, Tax & Accounting and the Reuters News businesses. The transaction will enable us to focus on expanding our business and accelerating revenue growth in the legal, tax and accounting and regulatory market segments.
We expect to receive approximately $17.0 billion in gross proceeds at closing (subject to purchase price adjustments). We currently expect to use the proceeds of the transaction as follows:
| (1) | Utilize between $1.5 billion and $2.5 billion to pay cash taxes, pension contributions, bond redemption costs and other fees and outflows related to the transaction, which includes $500 million to $600 million to reduce our cost base and make investments to reposition our company following the separation of the businesses; |
| (2) | Repay between $3.0 billion and $4.0 billion of debt, which would enable us to remain well below our target leverage ratio of net debt to adjusted EBITDA of 2.5:1. Therefore, the company no longer anticipates the need for shareholder participation in the dividend reinvestment plan (DRIP) greater than current levels following the closing of the transaction; |
| (3) | Invest between $1.0 billion and $3.0 billion to fund focused acquisitions to bolster our position in key growth segments; and |
| (4) | Return the balance of approximately $9.0 billion to $10.0 billion to our shareholders via a substantial issuer bid/tender offer made to all common shareholders to purchase a portion of our outstanding common shares after the closing date of the transaction. Our principal shareholder, Woodbridge, is expected to participate pro rata in the substantial issuer bid/tender offer. |
The transaction is expected to close in the second half of 2018 and is subject to specified antitrust/competition and financial regulatory approvals and other customary closing conditions. We have satisfied certain of these conditions, including receiving early termination of the applicable waiting period under the Hart-Scott-Rodino Antitrust Improvements Act of 1976.
Page 3
On the closing date of the transaction, Reuters News and the new Financial & Risk partnership will sign a 30-year agreement for Reuters News to supply news and editorial content to the partnership for a minimum amount of $325 million per year. For the duration of the news agreement, we will grant the Financial & Risk partnership a license to permit it to brand its products/services and company name with the “Reuters” mark, subject to applicable limitations and restrictions set forth in a trademark license agreement.
Upon closing of the transaction, our global workforce of 47,000 employees will be split between Thomson Reuters and the Financial & Risk partnership and we have informed staff of their designations. Approximately 20,000 employees will transfer from Thomson Reuters to the new partnership, including staff from our Corporate functions. Corporate staff will be primarily from ET&O and GGO, but will also include staff from our Finance, Human Resources, Legal, Strategy and Communications functions. We continue our planning to operationally separate the two businesses, including our shared technology infrastructure.
The proposed strategic partnership highlights our efforts and the success that we have had investing to stabilize and grow our financial services business over the last several years. We believe that our 45% equity stake in a well-positioned financial business with a strong strategic partner will also allow us to participate in the future upside for the business. We believe that Blackstone brings a deep understanding of the financial services ecosystem and a global footprint, and that it is well-positioned to identify and shape trends in the financial services industry, navigate ongoing industry consolidation and drive further efficiencies in the Financial & Risk business. We also believe that Blackstone has capacity and flexibility to invest for the long-term, both organically and inorganically. Blackstone and the new Financial & Risk partnership believe that through adoption of innovative technologies to increase automation, other efficiency initiatives and effective cost management, they can achieve a cost savings run rate of up to $650 million at the end of the five-year period following the closing of the transaction. A significant portion of these savings are planned to be reinvested in growth initiatives for the Financial & Risk business.
The information in this section is forward-looking and should be read in conjunction with the section entitled “Cautionary Note Concerning Factors That May Affect Future Results”. See the “Subsequent Events” section of this management’s discussion and analysis for additional information.
Discontinued Operations
Financial & Risk is classified as a discontinued operation for 2018 reporting purposes. To facilitate a comparison with our 2017 results, prior-year period amounts in this management’s discussion and analysis have been restated to conform to the current period’s presentation. See “Results of Discontinued Operations” section of this management’s discussion and analysis for additional information.
Seasonality
Our revenues and operating profit on a consolidated basis do not tend to be significantly impacted by seasonality as we record a large portion of our revenues ratably over a contract term and our costs are generally incurred evenly throughout the year. However, the performance of the Tax & Accounting segment from quarter to consecutive quarter can be impacted by the release of certain tax products, which tend to be concentrated in the fourth quarter and, to a lesser extent, in the first quarter of the year.
Page 4
Key Financial Highlights
Below are financial highlights from our first quarter 2018 results, which are on a continuing operations basis, except where otherwise noted.
| Three months ended March 31, | ||||||||||||||||
| Change | ||||||||||||||||
| (millions of U.S. dollars, except per share amounts and margins) | 2018 | 2017 | Total | Constant Currency |
||||||||||||
| IFRS Financial Measures |
||||||||||||||||
| Revenues |
1,379 | 1,331 | 4% | |||||||||||||
| Operating profit |
268 | 274 | (2%) | |||||||||||||
| Diluted (loss) earnings per share (includes discontinued operations) |
$ | (0.48) | $ | 0.41 | n/m | |||||||||||
| Cash flow from operations (includes discontinued operations) |
419 | (368) | n/m | |||||||||||||
| Non-IFRS Financial Measures(1) |
||||||||||||||||
| Revenues |
1,379 | 1,331 | 4% | 3% | ||||||||||||
| Adjusted EBITDA |
430 | 415 | 4% | 3% | ||||||||||||
| Adjusted EBITDA margin |
31.2% | 31.2% | - | - | ||||||||||||
| Adjusted EPS |
$0.28 | $ | 0.25 | 12% | 12% | |||||||||||
| Free cash flow (includes discontinued operations) |
120 | (585) | n/m | |||||||||||||
| (1) | Refer to Appendix A for additional information on non-IFRS financial measures. |
Our revenues increased 4% in total, 3% in constant currency, driven by recurring revenue growth in our Legal and Tax & Accounting businesses. Operating profit declined 2% as the prior-year period included a gain on an investment. Adjusted EBITDA increased as higher revenues more than offset higher expenses, and our adjusted EBITDA margin remained unchanged at 31.2%. Diluted loss per share of $0.48 reflected an $844 million deferred tax charge associated with the proposed sale of a 55% interest in our Financial & Risk business, which was recorded in discontinued operations (see the “Results of Discontinued Operations” section for more information). Adjusted EPS, which excludes discontinued operations among other items, increased 12% to $0.28 per share due to higher adjusted EBITDA and lower interest. The increase in cash flow from operations was primarily because the prior-year period included a $500 million pension contribution and severance payments as well as the timing of other working capital movements. Free cash flow increased due to the same factors as cash flow from operations.
In 2018, our priorities are to:
| ● | Separate the Financial & Risk business from Thomson Reuters. In anticipation of the proposed strategic partnership, we are planning to separate our Financial & Risk business and Thomson Reuters into two stand-alone businesses. This involves developing plans to separate employees, technology infrastructure, and supplier contracts, as well as to execute transitional services after the closing of the transaction. |
| ● | Reposition Thomson Reuters. As part of our efforts to accelerate the revenue growth of our continuing business, we plan to reposition our company by building a more customer-centric operating model. We are focusing on delivering solutions that can apply advanced analytics to the combined data of our company, customers and third parties. We will continue to automate knowledge work by incorporating artificial intelligence, machine learning and cognitive computing. Additionally, as a result of the transaction, we are planning to realign our cost base for our remaining smaller company. |
| ● | Grow through Digital Evolution. We believe that we can drive revenue growth from improved customer analytics and a more effective digital sales model. We plan to build a digital customer experience and sales channel for smaller tax and legal firms that make up a significant portion of our customer base. We are focused on making it easier for customers to buy our products and services. We also are prioritizing investing in and expanding our position in the corporate market segment. |
Page 5
2018 Outlook:
The following table sets forth our 2018 full-year business outlook for our continuing operations. For comparative purposes, 2017 actual amounts provided below have been restated to exclude Financial & Risk, which is classified as a discontinued operation for the full year 2018.
Total Corporate costs are expected to be between $500 million and $600 million in 2018. In addition to core corporate costs, we expect to incur the following as part of our overall corporate costs:
| ● | Stranded costs, which we define as costs that will not be eliminated with the sale of the 55% interest in Financial & Risk, as well as costs due to dis-synergies from losing certain benefits of scale from the transaction; and |
| ● | Costs and investments to reposition the ongoing Thomson Reuters business following the separation of Financial & Risk from the rest of the company. |
| Non-IFRS Financial Measures(1) | 2017 Actual(2) | 2018 Outlook | ||
| Revenues |
$5.3 billion | Low single digit growth (excludes 2018 payment to Reuters News from Financial & Risk following the closing of the proposed strategic partnership transaction) | ||
| Adjusted EBITDA |
$1.6 billion | Between $1.2 billion and $1.3 billion (including the corporate costs referred to below) | ||
| Total Corporate costs |
$244 million | Between $500 million and $600 million (including stranded costs and investments to reposition our company following the separation of the business) | ||
| Depreciation and amortization of computer software |
$496 million | Between $500 million and $525 million | ||
| Capital expenditures, as a percentage of revenues |
9.9% | Approximately 10% of revenues | ||
| Interest expense |
$358 million | Approximately $165 million for the first half of the year. The company plans to provide an outlook for its second half interest expense at a later date as those expenses are based on the closing date of the Financial & Risk transaction | ||
| Effective tax rate on adjusted earnings |
11.4% | Between 14% and 16% |
| (1) | Refer to Appendix A for additional information on non-IFRS financial measures. |
| (2) | Refer to Appendix C for details of our 2017 revenues and adjusted EBITDA as reported in our 2017 annual management’s discussion and analysis, and as revised to exclude our Financial & Risk business. |
Our 2018 outlook assumes constant currency rates relative to 2017. The 2018 outlook does not factor in the impact of any acquisitions or divestitures that may occur during the year except for our planned sale of a 55% interest in the Financial & Risk business.
Additional information is provided in the “Outlook” section of this management’s discussion and analysis. The information in this section is forward-looking and should also be read in conjunction with the section of this management’s discussion and analysis entitled “Cautionary Note Concerning Factors That May Affect Future Results”.
Page 6
Results of Operations—Continuing Operations
Consolidated results
| Three months ended March 31, | ||||||||||||||||
| Change | ||||||||||||||||
| (millions of U.S. dollars, except per share amounts and margins) | 2018 | 2017 | Total | Constant Currency |
||||||||||||
| IFRS Financial Measures |
||||||||||||||||
| Revenues |
1,379 | 1,331 | 4% | |||||||||||||
| Operating profit |
268 | 274 | (2%) | |||||||||||||
| Diluted EPS from continuing operations |
$ | 0.24 | $ | 0.20 | 20% | |||||||||||
| Non-IFRS Financial Measures(1) |
||||||||||||||||
| Revenues |
1,379 | 1,331 | 4% | 3% | ||||||||||||
| Adjusted EBITDA |
430 | 415 | 4% | 3% | ||||||||||||
| Adjusted EBITDA margin |
31.2% | 31.2% | - | - | ||||||||||||
| Adjusted EBITDA less capital expenditures |
251 | 307 | (18%) | |||||||||||||
| Adjusted EBITDA less capital expenditures margin |
18.2% | 23.1% | (490)bp | |||||||||||||
| Adjusted EPS |
$ | 0.28 | $ | 0.25 | 12% | 12% | ||||||||||
| (1) | Refer to Appendix A for additional information on non-IFRS financial measures. Refer to Appendix B for a reconciliation of earnings of continuing operations to adjusted EBITDA and adjusted EBITDA less capital expenditures. |
Foreign currency effects
As set forth in the table above, fluctuations in foreign exchange rates impact our results given our currency mix of revenues and expenses around the world. Average foreign exchange rates for the most significant foreign currencies that we transact in were as follows:
| Three months ended March 31, | ||||||||||||
| (U.S. dollars per unit, except where noted) | 2018 | 2017 | U.S. Dollar Strengthened/ (Weakened) vs. Foreign Currency |
|||||||||
| British pound sterling |
1.392 | 1.239 | (12.3%) | |||||||||
| Euro |
1.229 | 1.066 | (15.3%) | |||||||||
| Japanese yen (100) |
0.924 | 0.880 | (5.0%) | |||||||||
| Canadian dollar |
0.791 | 0.756 | (4.6%) | |||||||||
Revenues
| Three months ended March 31, | ||||||||||||||||
| Change | ||||||||||||||||
| (millions of U.S. dollars, except margins) | 2018 | 2017 | Total | Constant Currency |
||||||||||||
| Recurring revenues |
1,009 | 955 | 6% | 4% | ||||||||||||
| Transactions revenues |
200 | 203 | (1%) | (1%) | ||||||||||||
| Print revenues |
172 | 174 | (1%) | (2%) | ||||||||||||
| Eliminations |
(2) | (1) | ||||||||||||||
| Revenues |
1,379 | 1,331 | 4% | 3% | ||||||||||||
Revenues increased 4% in total and 3% in constant currency, which was comprised of 2% organic growth and a 1% benefit from the January 1, 2018 adoption of a new accounting standard, IFRS 15. While IFRS 15 does not have a material impact on our results overall, it required us to accelerate about $4 million of Tax & Accounting revenues into the first quarter from later in the year. Our organic growth reflected higher recurring revenues, which more than offset declines in transactions and print revenues.
Page 7
Operating profit, adjusted EBITDA and adjusted EBITDA less capital expenditures
Operating profit decreased slightly as the prior-year period included a gain on an investment.
Adjusted EBITDA increased in total and in constant currency as higher revenues more than offset higher operating expenses. Adjusted EBITDA margin was unchanged compared to the prior-year period.
Adjusted EBITDA less capital expenditures and the related margin decreased as higher capital expenditures, which were partly timing related, more than offset the increase in adjusted EBITDA.
Operating expenses
| Three months ended March 31, | ||||||||||||||||
| Change | ||||||||||||||||
| (millions of U.S. dollars) | 2018 | 2017 | Total | Constant Currency |
||||||||||||
| Operating expenses |
952 | 911 | 5% | 3% | ||||||||||||
| Remove fair value adjustments(1) |
(3) | 5 | ||||||||||||||
| Operating expenses, excluding fair value adjustments |
949 | 916 | 4% | 3% | ||||||||||||
| (1) | Fair value adjustments primarily represent gains or losses due to changes in foreign currency exchange rates on intercompany balances that arise in the ordinary course of business. |
Operating expenses, excluding fair value adjustments, increased in both total and on a constant currency basis due to investments to improve the digital capabilities of our products and customer experience and to higher employee-related costs.
Depreciation and amortization
| Three months ended March 31, | ||||||||||||
| (millions of U.S. dollars) | 2018 | 2017 | Change | |||||||||
| Depreciation |
30 | 28 | 7% | |||||||||
| Amortization of computer software |
98 | 96 | 2% | |||||||||
| Subtotal |
128 | 124 | 3% | |||||||||
| Amortization of other identifiable intangible assets |
29 | 35 | (17%) | |||||||||
| ● | Depreciation and amortization of computer software on a combined basis increased, as expenses associated with capital spending were partly offset by the completion of depreciation and amortization of assets acquired or developed in previous years. |
| ● | Amortization of other identifiable intangible assets decreased primarily due to the completion of amortization for certain identifiable intangible assets acquired in previous years. |
Other operating (losses) gains, net
| Three months ended March 31, | ||||||||
| (millions of U.S. dollars) | 2018 | 2017 | ||||||
| Other operating (losses) gains, net |
(2) | 13 | ||||||
In 2017, other operating gains, net, reflected a gain on an investment.
Net interest expense
| Three months ended March 31, | ||||||||||||
| (millions of U.S. dollars) | 2018 | 2017 | Change | |||||||||
| Net interest expense |
78 | 92 | (15%) | |||||||||
Net interest expense decreased as certain long-term debt obligations were refinanced with commercial paper and credit facility borrowings, which bear lower interest rates.
Page 8
Other finance (income) costs
| Three months ended March 31, | ||||||||
| (millions of U.S. dollars) | 2018 | 2017 | ||||||
| Other finance (income) costs |
(7) | 28 | ||||||
Other finance (income) costs included losses related to changes in foreign exchange contracts and gains or losses on the impact of fluctuations of foreign currency exchange rates on certain intercompany funding arrangements.
Tax expense
| Three months ended March 31, | ||||||||
| (millions of U.S. dollars) | 2018 | 2017 | ||||||
| Tax expense |
27 | 11 | ||||||
The tax expense in each period reflected the mix of taxing jurisdictions in which pre-tax profits and losses were recognized. Because the geographical mix of pre-tax profits and losses in interim periods may be different from that for the full year, tax expense or benefit in interim periods is not necessarily indicative of tax expense for the full year.
Additionally, the comparability of our tax expense was impacted by various transactions and accounting adjustments during each period. The following table sets forth certain components within income tax expense that impact comparability from period to period, including tax expense associated with items that are removed from adjusted earnings:
| Three months ended March 31, | ||||||||
| (millions of U.S. dollars) | 2018 | 2017 | ||||||
| Tax expense (benefit) | ||||||||
| Tax items impacting comparability: |
||||||||
| Deferred tax adjustments |
2 | - | ||||||
| Subtotal |
2 | - | ||||||
| Tax related to: |
||||||||
| Fair value adjustments |
- | 1 | ||||||
| Amortization of other identifiable intangible assets |
(6) | (11) | ||||||
| Other items |
1 | 8 | ||||||
| Subtotal |
(5) | (2) | ||||||
| Total |
(3) | (2) | ||||||
Because the items described above impact the comparability of our tax expense or benefit for each period, we remove them from our calculation of adjusted earnings, along with the pre-tax items to which they relate. The computation of our adjusted tax expense is set forth below:
| Three months ended March 31, | ||||||||
| (millions of U.S. dollars) | 2018 | 2017 | ||||||
| Tax expense |
27 | 11 | ||||||
| Remove: Items from above impacting comparability |
3 | 2 | ||||||
| Other adjustment: |
||||||||
| Interim period effective tax rate normalization(1) |
(4) | 5 | ||||||
| Total tax expense on adjusted earnings |
26 | 18 | ||||||
| (1) | Adjustment to reflect income taxes based on estimated full-year effective tax rate, including normalization of benefits from favorable developments in regard to tax disputes. Earnings or losses for interim periods under IFRS generally reflect income taxes based on the estimated effective tax rates of each of the jurisdictions in which we operate. The non-IFRS adjustment reallocates estimated full-year income taxes between interim periods, but has no effect on full-year income taxes. |
Page 9
Earnings and diluted EPS from continuing operations
| Three months ended March 31, | ||||||||||||
| (millions of U.S. dollars, except per share amounts) | 2018 | 2017 | Change | |||||||||
| Earnings from continuing operations |
172 | 145 | 19% | |||||||||
| Diluted EPS from continuing operations |
$ | 0.24 | $ | 0.20 | 20% | |||||||
Earnings from continuing operations and the related per share amount increased primarily due to the positive impact of foreign currency related to fair value adjustments on financing costs and lower interest expense, which were partly offset by higher income tax expense.
Adjusted earnings and adjusted EPS
| Three months ended March 31, | ||||||||||||||||
| Change | ||||||||||||||||
| (millions of U.S. dollars, except per share amounts and share data) | 2018 | 2017 | Total | Constant Currency |
||||||||||||
| Net (loss) earnings |
(311) | 314 | n/m | |||||||||||||
| Adjustments to remove: |
||||||||||||||||
| Fair value adjustments |
3 | (5) | ||||||||||||||
| Amortization of other identifiable intangible assets |
29 | 35 | ||||||||||||||
| Other operating losses (gains), net |
2 | (13) | ||||||||||||||
| Other finance (income) costs |
(7) | 28 | ||||||||||||||
| Share of post-tax earnings in equity method investments |
(2) | (2) | ||||||||||||||
| Tax on above items(1) |
(5) | (2) | ||||||||||||||
| Tax items impacting comparability(1) |
2 | - | ||||||||||||||
| Loss (earnings) from discontinued operations, net of tax |
483 | (169) | ||||||||||||||
| Interim period effective tax rate normalization(1) |
4 | (5) | ||||||||||||||
| Dividends declared on preference shares |
(1) | (1) | ||||||||||||||
| Adjusted earnings |
197 | 180 | 9% | |||||||||||||
| Adjusted EPS |
$0.28 | $0.25 | 12% | 12% | ||||||||||||
| Diluted weighted-average common shares (millions) |
711.5 | 729.2 | ||||||||||||||
| (1) | See the “Tax expense (benefit)” section above for additional information. |
Adjusted earnings and the related per share amount increased primarily due to higher adjusted EBITDA and lower interest expense.
Segment results
The following is a discussion of our three reportable segments for our continuing business for the three months ended March 31, 2018: Legal, Tax & Accounting and Reuters News. Beginning in the first quarter of 2018, Reuters News became a reportable segment. The Regulatory Intelligence and Compliance Learning businesses, which were previously reported as part of Financial & Risk business, will be retained after the closing of the proposed transaction and are now reported as part of the Legal segment.
We assess the performance of our reportable segments as follows:
Revenues
We present segment revenue growth at both actual foreign exchange rates and in constant currency. We assess revenue performance for each reportable segment, as well as the businesses within each segment, before the impact of currency (or at “constant currency”). We also analyze our revenue by three types, recurring, transactions and print, reflecting the nature of our business model. While much of our print revenues are recurring, we segregate our revenues from print products to highlight that our print revenues are steadily declining due to our customers’ preference for online products.
Page 10
Segment adjusted EBITDA and segment adjusted EBITDA margin
| ● | Segment adjusted EBITDA represents earnings from continuing operations before tax expense or benefit, net interest expense, other finance costs or income, depreciation, amortization of software and other identifiable intangible assets, the company’s share of post-tax earnings or losses in equity method investments, other operating gains and losses, certain asset impairment charges, fair value adjustments, and corporate related items. |
| ● | The company does not consider these excluded items to be controllable operating activities for purposes of assessing the current performance of the reportable segments. |
| ● | Each segment includes an allocation of costs for centralized support services such as technology, editorial, real estate and certain global transaction processing functions that are based on usage or other applicable measures. |
| ● | Segment adjusted EBITDA margin is segment adjusted EBITDA expressed as a percentage of revenues. |
Our “Corporate” category includes expenses for corporate functions.
Legal
| Three months ended March 31, | ||||||||||||||||
| Change | ||||||||||||||||
| (millions of U.S. dollars, except margins) | 2018 | 2017 | Total | Constant Currency |
||||||||||||
| Recurring revenues |
637 | 604 | 5% | 4% | ||||||||||||
| Transactions revenues |
76 | 77 | (1%) | (1%) | ||||||||||||
| Print revenues |
159 | 160 | (1%) | (2%) | ||||||||||||
| Revenues |
872 | 841 | 4% | 2% | ||||||||||||
| Segment adjusted EBITDA |
319 | 314 | 2% | 1% | ||||||||||||
| Segment adjusted EBITDA margin |
36.6% | 37.3% | (70)bp | (50)bp | ||||||||||||
On a constant currency basis, revenues increased 2% as growth in recurring revenues, which comprise the majority of Legal’s revenues, more than offset declines in transaction and print revenues. Excluding print, Legal’s revenues increased 3%.
| Revenue performance by line of business in constant currency was as follows:
|
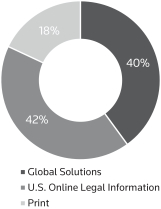
First Quarter 2018 Revenues by Line of Business
| |
| ● Global Solutions revenues include non-U.S. legal information and global software and services businesses. Global Solutions revenues increased 4%, as 6% growth in recurring revenues (82% of the Global Solutions business) was partly offset by a 2% decline in transactions revenues. Revenues increased for U.K. Practical Law, Investigative & Public Records, and Elite, while revenues in Legal Managed Services were lower;
● U.S. Online Legal Information revenues increased 2%, due to growth in U.S. Practical Law; and
● Print revenues, which include U.S. and international print businesses, decreased 2% and 4% organically. Total print revenues benefited from a 2% contribution from an acquisition. For the full year, we expect Legal’s print revenues will decline approximately 6% or 7% organically, which is similar to the declines that Legal experienced in recent years. |
|
Legal’s segment adjusted EBITDA increased on constant currency basis as the impact of higher revenues were partly offset by higher expenses, which included higher product and marketing investments as well as higher employee-related costs. Segment adjusted EBITDA margin decreased on a constant currency basis primarily due to the increase in expenses.
Page 11
Tax & Accounting
| Three months ended March 31, | ||||||||||||||||
| Change | ||||||||||||||||
| (millions of U.S. dollars, except margins) | 2018 | 2017 | Total | Constant Currency |
||||||||||||
| Recurring revenues |
310 | 288 | 8% | 8% | ||||||||||||
| Transactions revenues |
114 | 115 | (1%) | (1%) | ||||||||||||
| Print revenues |
13 | 14 | (7%) | (7%) | ||||||||||||
| Revenues |
437 | 417 | 5% | 5% | ||||||||||||
| Segment adjusted EBITDA |
147 | 141 | 4% | 5% | ||||||||||||
| Segment adjusted EBITDA margin |
33.6% | 33.8% | (20)bp | 10bp | ||||||||||||
On a constant currency basis, revenues increased 5% as growth in recurring revenues, which comprise the majority of Tax & Accounting’s revenues, were partly offset by declines in transactions and print revenues. Revenue growth included a 1% positive impact due to the January 1, 2018 adoption of a new accounting standard, IFRS 15. We expect IFRS 15 to have a nominal impact on Tax & Accounting’s revenues for the full year.
| Revenue performance by line of business in constant currency was as follows:
● Corporate includes revenues from federal, state, local and international tax compliance, planning and management software and services. Corporate revenues increased 6%, primarily due to growth in the ONESOURCE global tax compliance solution and higher revenues in Latin America;
● Professional includes revenues from tax, accounting, payroll, document management, and practice management software and services. Professional revenues increased 6%, primarily from growth in CS Professional Suite solutions for accounting firms and higher revenues in Latin America;
● Knowledge Solutions includes revenues from information, research, and certified professional education tools for tax and accounting professionals. Knowledge Solutions revenues increased 1% due to growth in Checkpoint revenues; and
● Government, which represents only 2% of Tax & Accounting’s revenues, includes integrated property tax management and land registry solutions. Government revenues decreased 1%. |
First Quarter 2018 Revenues
| |
|
|

Tax & Accounting’s segment adjusted EBITDA increased and the related margin increased slightly on a constant currency basis as the higher revenues were partly offset by higher expenses.
Tax & Accounting is a more seasonal business relative to our other businesses, with a higher percentage of its segment adjusted EBITDA historically generated in the fourth quarter and to a slightly lesser extent, the first quarter, due to the release of certain tax products. Small movements in the timing of revenues and expenses can impact quarterly margins. Full-year margins are more reflective of the segment’s performance.
Page 12
Reuters News
| Three months ended March 31, | ||||||||||||||||
| Change | ||||||||||||||||
| (millions of U.S. dollars, except margins) | 2018 | 2017 | Total | Constant Currency |
||||||||||||
| Recurring revenues |
62 | 63 | (2%) | (6%) | ||||||||||||
| Transactions revenues |
10 | 11 | (9%) | (9%) | ||||||||||||
| Revenues |
72 | 74 | (3%) | (7%) | ||||||||||||
| Segment adjusted EBITDA |
8 | 13 | (38%) | (38%) | ||||||||||||
| Segment adjusted EBITDA margin |
11.1% | 17.6% | (650)bp | (590bp) | ||||||||||||
Revenues decreased on a constant currency basis primarily due to lower recurring revenues, which comprise the majority of Reuters News’ revenues, reflecting a decline in news agency spending. Transactions revenues also declined.
Segment adjusted EBITDA and the related margin for Reuters News decreased on a constant currency basis due to lower revenues.
Reuters News currently supplies news and editorial content to Financial & Risk. The costs to produce this content are currently allocated to our Financial & Risk business and therefore are included as part of discontinued operations, rather than as a component of Reuters News’ adjusted EBITDA. Upon the closing of the strategic partnership transaction, Reuters News will report these costs as part of its adjusted EBITDA. At the same time, Reuters News will begin to recognize revenue of $325 million per year under a new 30-year agreement to continue to supply news and editorial content to the Financial & Risk partnership. The revenue is expected to largely offset the associated expenses within the results of Reuters News.
Corporate
| Three months ended March 31, | ||||||||
| (millions of U.S. dollars) | 2018 | 2017 | ||||||
| Corporate costs |
44 | 53 | ||||||
The decrease in corporate costs was due to timing of expenses.
Results of Discontinued Operations
(Loss) earnings from discontinued operations, net of tax includes the following:
| Three months ended March 31, | ||||||||
| (millions of U.S. dollars) | 2018 | 2017 | ||||||
| Financial & Risk |
(482) | 172 | ||||||
| Intellectual Property & Science (IP & Science) |
(1) | (3) | ||||||
| (Loss) earnings from discontinued operations, net of tax |
(483) | 169 | ||||||
The results of discontinued operations for Financial & Risk in the first quarter of 2018 reflected an $844 million deferred tax charge associated with the proposed sale of a 55% interest in our Financial & Risk business. These deferred taxes were not previously required as the business was not considered held for sale until January 2018. The company estimates that a cash tax payment of approximately $300 million will arise in 2018 in connection with the closing of the transaction and the remainder would be deferred until such time as our company disposes of its 45% interest in the new partnership.
Excluding the impact of the tax charge, the results of discontinued operations increased primarily due to higher revenues as well as a benefit from lower depreciation and amortization of software and other identifiable intangible assets as assets held for sale are not depreciated. Refer to the “Financial & Risk” section below for additional details.
Amounts related to IP & Science include residual expense and income items, which were borne by our company following our sale of that business in October 2016.
Page 13
Financial & Risk
Due to the continuing significance of the Financial & Risk business to our company, supplemental information about its performance is provided below. Following the closing of the strategic partnership transaction, we plan to continue to provide this information as well as information related to Financial & Risk’s debt, which will be incurred at the partnership level to finance part of the transaction.
| Three months ended March 31, | ||||||||||||||||
| Change | ||||||||||||||||
| (millions of U.S. dollars, except margins) | 2018 | 2017 | Total | Constant Currency |
||||||||||||
| Recurring revenues |
1,212 | 1,150 | 5% | 1% | ||||||||||||
| Transactions revenues |
252 | 215 | 17% | 14% | ||||||||||||
| Recoveries revenues |
119 | 120 | (1%) | (5%) | ||||||||||||
| Revenues |
1,583 | 1,485 | 7% | 3% | ||||||||||||
| Segment adjusted EBITDA |
526 | 461 | 14% | 9% | ||||||||||||
| Segment adjusted EBITDA margin |
33.2% | 31.0% | 220bp | 200bp | ||||||||||||
| Cash flow from operations |
210 | 70 | n/m | |||||||||||||
| Free cash flow(1) |
91 | (44) | n/m | |||||||||||||
| Capital expenditures |
108 | 105 | 3% | |||||||||||||
| (1) | Refer to Appendix A for additional information on non-IFRS financial measures. |
Revenues increased on a constant currency basis due to increases in recurring and transactions revenues. Transactions revenues increased 14% primarily due to growth in Tradeweb and higher foreign exchange trading revenues.
Segment adjusted EBITDA and the related margin increased reflecting higher revenues and continued expense reductions related to technology.
Cash flow from operations increased primarily due to higher earnings, excluding non-cash items, and because the prior-year period included severance payments. The increase in free cash flow reflected the same factors as cash flow from operations.
Liquidity and Capital Resources
Our principal sources of liquidity are cash on hand, cash provided by our operations, our commercial paper programs and credit facilities. From time to time, we also issue debt securities. Our principal uses of cash are for debt repayments, debt servicing costs, dividend payments, capital expenditures, share repurchases and acquisitions. We believe that our existing sources of liquidity will be sufficient to fund our expected cash requirements in the normal course of business for the next 12 months.
We expect to receive approximately $17.0 billion in gross proceeds at the closing of our proposed transaction to create a strategic partnership and sell a 55% interest in our Financial & Risk business. We plan to take a balanced approach regarding the use of these proceeds. We expect to use between $1.5 billion and $2.5 billion for related taxes, pension contributions, and other fees and outflows related to the transaction, which includes $500 million to $600 million to reduce our cost base and make investments to reposition our company following the separation of the businesses. We expect to redeploy the balance of the proceeds to repay debt, repurchase outstanding common shares and fund acquisitions (see the “Executive Summary – Proposed Financial & Risk Strategic Partnership” section of this management’s discussion and analysis for additional information). While we will continue to focus on driving organic revenue growth, we will plan to supplement our capital strategy to drive growth through focused acquisitions to bolster our position in key growth segments.
Page 14
Cash flow
Summary of consolidated statement of cash flow
The following discussion relates to the total cash flows of our business, including discontinued operations.
| Three months ended March 31, | ||||||||||||
| (millions of U.S. dollars) | 2018 | 2017 | $ Change | |||||||||
| Net cash provided by (used in) operating activities |
419 | (368) | 787 | |||||||||
| Net cash used in investing activities |
(314) | (375) | 61 | |||||||||
| Net cash used in financing activities |
(130) | (826) | 696 | |||||||||
| Decrease in cash and bank overdrafts |
(25) | (1,569) | 1,544 | |||||||||
| Translation adjustments |
1 | 2 | (1) | |||||||||
| Cash and bank overdrafts at beginning of period |
868 | 2,367 | (1,499) | |||||||||
| Cash and bank overdrafts at end of period |
844 | 800 | 44 | |||||||||
| Cash and bank overdrafts at end of period comprised of: |
||||||||||||
| Cash and cash equivalents |
502 | 812 | (310) | |||||||||
| Cash and cash equivalents in assets held for sale |
346 | — | 346 | |||||||||
| Bank overdrafts |
(4) | (12) | 8 | |||||||||
Operating activities. Net cash provided by operating activities increased primarily because the prior-year period included a $500 million pension contribution and severance payments. The timing of working capital movements also contributed.
Investing activities. Net cash used in investing activities decreased due to lower acquisition spending, despite higher capital expenditures for products and technology infrastructure. In the first quarter of 2018, acquisition spending was $27 million compared to $178 million in the prior-year period.
Financing activities. Net cash used in financing activities decreased as the current period included net borrowings of debt, while the prior-year period included net repayments of debt. Additionally, there were no share repurchases in the current period, while the prior-year period included $284 million of share repurchases. We returned $236 million to our common shareholders through dividends in the first quarter of 2018 (2017 – $526 million through dividends and share repurchases).
Additional information about our debt, dividends and share repurchases is as follows:
| ● | Commercial paper programs. Our $2.0 billion commercial paper programs provide cost-effective and flexible short-term funding. Issuances of commercial paper reached a peak of $1.7 billion during the first quarter of 2018, of which $389 million was outstanding at March 31, 2018. |
| ● | Credit facilities. The company has two facilities available: |
| ¡ | The $2.4 billion credit facility matures in November 2021 and may be used to provide liquidity for general corporate purposes (including support for our commercial paper programs). At March 31, 2018, outstanding current borrowings were $368 million. The cost of borrowing was priced at LIBOR plus 100 basis points. We may request an increase in the lenders’ commitments up to a maximum amount of $3.0 billion, subject to approval by applicable lenders. |
| ¡ | The $1.5 billion credit facility, is comprised of a $0.5 billion term loan facility and a $1.0 billion revolving credit facility that expires on November 21, 2018. The term loan facility may be used to fund acquisitions up to June 30, 2018. The revolving credit facility may be used for general corporate purposes up to the expiration date. At March 31, 2018, outstanding current borrowings were $1.0 billion. The cost of borrowing was priced at LIBOR plus 87.5 basis points. |
In the event our long-term debt rating was downgraded by Moody’s or Standard & Poor’s, our facility fees and borrowing costs may increase, although availability would be unaffected. Conversely, an upgrade in our ratings may reduce our facility fee and borrowing costs. We monitor the lenders that are party to our facilities and believe they continue to be able to lend to us.
We guarantee borrowings by our subsidiaries under the credit facilities. We must also maintain a ratio of net debt as of the last day of each fiscal quarter to EBITDA as defined in the credit agreements (earnings before interest, income taxes, depreciation and amortization and other modifications described in the credit agreements) for the last four quarters ended of not more than 4.5:1. We were in compliance with this covenant at March 31, 2018.
Page 15
| ● | Debt shelf prospectus. Our debt shelf prospectus under which we were eligible to issue up to $3.0 billion principal amount of debt securities expired in April 2018. We plan to file a new debt shelf prospectus in the second quarter of 2018. |
| ● | Long-term debt. We repaid the following notes in the three months ended March 31, 2017: |
| Month/Year | Transaction | Principal Amount (in millions) | ||
| Notes repaid | ||||
| February 2017 |
1.30% Notes, due 2017 | US$550 |
| ● | Credit ratings. Our access to financing depends on, among other things, suitable market conditions and the maintenance of suitable long-term credit ratings. Our credit ratings may be adversely affected by various factors, including increased debt levels, decreased earnings, declines in customer demand, increased competition, a further deterioration in general economic and business conditions and adverse publicity. Any downgrades in our credit ratings may impede our access to the debt markets or result in significantly higher borrowing rates. |
Our credit ratings have not changed in 2018 and through the date of this management’s discussion and analysis. Following the announcement of our proposed Financial & Risk strategic partnership, several ratings agencies announced that our credit ratings were on negative watch. Our credit ratings may be lowered in the future as a result of the proposed transaction or otherwise.
The following table sets forth the credit ratings that we have received from rating agencies in respect of our outstanding securities as of the date of this management’s discussion and analysis:
| Moody’s | Standard & Poor’s | DBRS Limited | Fitch | |||||
| Long-term debt |
Baa2 | BBB+ | BBB (high) | BBB+ | ||||
| Commercial paper |
P-2 | A-2 | R-2 (high) | F2 | ||||
| Trend/Outlook |
Negative Watch | Negative Watch | Stable | Negative Watch | ||||
These credit ratings are not recommendations to purchase, hold, or sell securities and do not address the market price or suitability of a specific security for a particular investor.
| ● | Dividends. Dividends on our common shares are declared in U.S. dollars. In our consolidated statement of cash flow, dividends paid on common shares are shown net of amounts reinvested in our company under our dividend reinvestment plan (DRIP). Registered holders of common shares may participate in our DRIP, under which cash dividends are automatically reinvested in new common shares. |
Details of dividends declared per common share and dividends paid on common shares are as follows:
| Three months ended March 31, | ||||||||
| (millions of U.S. dollars, except per share amounts) | 2018 | 2017 | ||||||
| Dividends declared per common share |
$ | 0.345 | $ | 0.345 | ||||
| Dividends declared |
245 | 251 | ||||||
| Dividends reinvested |
(9) | (9) | ||||||
| Dividends paid |
236 | 242 | ||||||
| ● | Share repurchases. We may buy back shares (and subsequently cancel them) from time to time as part of our capital strategy. Share repurchases are effected under a normal course issuer bid (NCIB). Under our current NCIB, we may repurchase up to 36 million common shares between May 30, 2017 and May 29, 2018 in open market transactions on the Toronto Stock Exchange (TSX), the New York Stock Exchange (NYSE) and/or other exchanges and alternative trading systems, if eligible, or by such other means as may be permitted by the TSX and/or NYSE or under applicable law, including private agreement purchases if we receive an issuer bid exemption order from applicable securities regulatory authorities in Canada for such purchases. The price that our company will pay for shares in open market transactions under the NCIB will be the market price at the time of purchase or such other price as may be permitted by TSX. In the first quarter of 2017, we privately repurchased 5 million common shares at a discount to the then-prevailing market price. We intend to renew our NCIB in connection with the expiration of our existing NCIB for an additional 12 month period. |
We did not make share repurchases in the first quarter of 2018. In the first quarter of 2017, we repurchased 6.8 million common shares for $284 million at an average price per share of $41.69.
Page 16
In May 2018, the company announced that it may buy back of up to $500 million of its shares prior to the closing of the proposed Financial & Risk transaction under its NCIB (refer to the “Subsequent Events” section of this management’s discussion and analysis). Any repurchases under the NCIB prior to the closing of the proposed Financial & Risk transaction will reduce the size of the contemplated post-closing substantial issuer bid/tender offer made to all shareholders, which may be at a premium to the then-current market price of the company’s shares. As discussed earlier in this management’s discussion and analysis, the company currently expects to use between $9.0 billion and $10.0 billion of the estimated $17.0 billion of gross proceeds of the transaction to provide returns to its shareholders through a substantial issuer bid/tender offer. The company’s principal shareholder, Woodbridge, is expected to participate pro rata in the substantial issuer bid/tender offer.
Decisions regarding any future repurchases will depend on the timing of the closing of the proposed strategic partnership transaction and other factors, such as market conditions, share price and other opportunities to invest capital for growth. We may elect to suspend or discontinue our share repurchases at any time, in accordance with applicable laws.
Free cash flow
The following discussion relates to the total cash flows of our business, including discontinued operations.
| Three months ended March 31, | ||||||||
| (millions of U.S. dollars) | 2018 | 2017 | ||||||
| Net cash provided by (used in) operating activities |
419 | (368) | ||||||
| Capital expenditures, less proceeds from disposals |
(179) | (108) | ||||||
| Capital expenditures from discontinued operations |
(108) | (105) | ||||||
| Other investing activities |
- | 6 | ||||||
| Dividends paid on preference shares |
(1) | (1) | ||||||
| Dividends paid to non-controlling interests from discontinued operations |
(11) | (9) | ||||||
| Free cash flow |
120 | (585) | ||||||
Free cash flow increased in the first quarter of 2018 compared to the prior-year period due to higher cash from operating activities, despite higher capital expenditures.
Financial position
Our total assets were $27.0 billion at March 31, 2018, an increase of $0.5 billion from December 31, 2017. The increase was primarily due to capital expenditures and foreign currency translation, partly offset by depreciation of fixed assets and amortization of computer software and other identifiable intangible assets.
At March 31, 2018, the carrying amounts of our total current liabilities (excluding liabilities held for sale) exceeded the carrying amounts of our total current assets (excluding assets held for sale) by $1.8 billion. Of this amount, current liabilities included $1.4 billion outstanding under our credit facilities, most of which we expect to repay with the proceeds from the proposed strategic partnership transaction. We believe that, we can refinance this amount at any time if needed. Current liabilities also include $0.7 billion of deferred revenue, which arises from the sale of subscription based products and services that many customers pay for in advance. The cash received from these advance payments is used to currently fund the operating, investing and financing activities of our business. However, for accounting purposes, these advance payments must be deferred and recognized over the term of the subscription. As such, we typically reflect a negative working capital position in our consolidated statement of financial position. In the ordinary course of business, deferred revenue does not represent a cash obligation, but rather an obligation to perform services or deliver products. Therefore, we believe this portion of negative working capital position at March 31, 2018 was not indicative of a liquidity issue, but rather an outcome of the required accounting for our business model.
Page 17
Net debt(1)
| March 31, | December 31, | |||||||
| (millions of U.S. dollars) | 2018 | 2017 | ||||||
| Current indebtedness |
1,760 | 1,644 | ||||||
| Long-term indebtedness |
5,343 | 5,382 | ||||||
| Total debt |
7,103 | 7,026 | ||||||
| Swaps |
277 | 246 | ||||||
| Total debt after swaps |
7,380 | 7,272 | ||||||
| Remove fair value adjustments for hedges(2) |
19 | 9 | ||||||
| Total debt after currency hedging arrangements |
7,399 | 7,281 | ||||||
| Remove transaction costs and discounts included in the carrying value of debt |
55 | 59 | ||||||
| Less: cash and cash equivalents(3) |
(502) | (874) | ||||||
| Net debt |
6,952 | 6,466 | ||||||
| (1) | Net debt is a non-IFRS financial measure, which we define in Appendix A of this management’s discussion and analysis. |
| (2) | Represents the interest-related fair value component of hedging instruments that are removed to reflect net cash outflow upon maturity. |
| (3) | Includes cash and cash equivalents of $20 million and $126 million at March 31, 2018 and December 31, 2017, respectively, held in subsidiaries, which have regulatory restrictions, contractual restrictions or operate in countries where exchange controls and other legal restrictions apply and are therefore not available for general use by our company. |
At March 31, 2018, our total debt position (after swaps) was $7.4 billion. The maturity dates for our term debt are well balanced with no significant concentration in any one year. Our next scheduled long-term debt maturity does not occur until May 2019. At March 31, 2018, the average maturity of our term debt (total debt excluding commercial paper and credit facilities) was approximately nine years at an average interest rate (after swaps) of less than 5%. We currently intend to use between $3.0 billion and $4.0 billion of the proceeds from the proposed Financial & Risk strategic partnership transaction to repay debt. If we repay that amount after closing, we would remain well below our target leverage ratio of net debt to adjusted EBITDA of 2.5:1.
Off-balance sheet arrangements, commitments and contractual obligations
For a summary of our other off-balance sheet arrangements, commitments and contractual obligations please see our 2017 annual management’s discussion and analysis. There were no material changes to these arrangements, commitments and contractual obligations during the three months ended March 31, 2018.
Contingencies
Lawsuits and legal claims
We are engaged in various legal proceedings, claims, audits and investigations that have arisen in the ordinary course of business. These matters include, but are not limited to, employment matters, commercial matters, defamation claims and intellectual property infringement claims. The outcome of all of the matters against us is subject to future resolution, including the uncertainties of litigation. Based on information currently known to us and after consultation with outside legal counsel, management believes that the ultimate resolution of any such matters, individually or in the aggregate, will not have a material adverse impact on our financial condition taken as a whole.
Uncertain tax positions
We are subject to taxation in numerous jurisdictions and we are routinely under audit by many different taxing authorities in the ordinary course of business. There are many transactions and calculations during the course of business for which the ultimate tax determination is uncertain, as taxing authorities may challenge some of our positions and propose adjustments or changes to our tax filings.
As a result, we maintain provisions for uncertain tax positions that we believe appropriately reflect our risk. These provisions are made using our best estimate of the amount expected to be paid based on a qualitative assessment of all relevant factors. We review the adequacy of these provisions at the end of each reporting period and adjust them based on changing facts and circumstances. Due to the uncertainty associated with tax audits, it is possible that at some future date, liabilities resulting from such audits or related litigation could vary significantly from our provisions. However, based on currently enacted legislation, information currently known to us and after consultation with outside tax advisors, management believes that the ultimate resolution of any such matters, individually or in the aggregate, will not have a material adverse impact on our financial condition taken as a whole.
For additional information, please see the “Risk Factors” section of our 2017 annual report, which contains further information on risks related to tax matters.
Page 18
The information in this section is forward-looking and should be read in conjunction with the part of the “Additional Information” section below entitled “Cautionary Note Concerning Factors That May Affect Future Results”.
Consistent with prior years, our guidance is provided before currency. Our outlook for revenue growth and adjusted EBITDA:
| ● | Assumes constant currency rates relative to 2017; |
| ● | Excludes the Financial & Risk business, which has been classified as a discontinued operation; and |
| ● | Does not factor in the impact of acquisitions or divestitures that may occur during the year except for the company’s planned sale of a 55% interest in the Financial & Risk business. |
The following table sets forth our 2018 financial outlook for revenue growth and adjusted EBITDA, as well as the material assumptions and the material risks that may cause actual performance to differ materially from our expectations for those measures.
|
Revenues expected to grow low single digits (excludes 2018 payment to Reuters News from Financial & Risk following the closing of the proposed strategic partnership) | ||
|
Material assumptions |
Material risks | |
|
● Gross domestic product (GDP) growth in most of the countries where we operate
● Continued demand for products and services that help customers navigate changing geopolitical, economic and regulatory environments
● An increase in demand for information and workflow solutions
● Accelerated growth in Legal & Tax & Accounting businesses due to increased focus. |
● Global economic uncertainty due to factors including continued regulatory reform around the world, changes in the political environment may limit business opportunities for our customers, lowering their demand for our products and services
● Demand for our products and services could be reduced by changes in customer buying patterns, or our inability to execute on key product or customer support initiatives
● Pressure on certain customers, in developed markets in particular, may constrain the number of professionals employed
● Competitive pricing actions could impact our revenues
● Our sales and product initiatives may be insufficient to retain customers or generate new sales
| |
|
Adjusted EBITDA to be between $1.2 billion and $1.3 billion
| ||
|
Material assumptions |
Material risks | |
| ● Revenues expected to grow at low single digits
● Business mix continues to shift to higher-growth product offerings
● Continued investment in growth markets, customer service, product development and digital capabilities
● The proposed Financial & Risk strategic partnership transaction closes in the second half of 2018
● The costs to separate the Financial & Risk business from Thomson Reuters, as well as our ability to reduce our cost base, are in line with our estimates |
● Same as the risks above related to the revenue outlook
● The costs of required investments, exceed expectations or actual returns are below expectations
● Acquisition and disposal activity may dilute adjusted EBITDA
● We are unable to close the proposed Financial & Risk strategic partnership transaction, or the closing may take longer than expected
●
Our estimate of costs to separate our businesses as well as our estimates regarding the reduction of our cost base may be inaccurate
| |
For the full year of 2018, we expect corporate costs to be between $500 million and $600 million and that they will increase over the balance of the year. The 2018 estimate is comprised of:
| ● | Approximately $140 million of core corporate costs; |
| ● | Approximately $150 million of stranded costs, which we define as costs that will not be eliminated with the sale of the 55% interest in Financial & Risk, as well as costs due to dis-synergies from losing certain benefits of scale from the transaction; and |
| ● | Between $200 million and $300 million for investments to reposition the ongoing Thomson Reuters business following the separation of Financial & Risk from the rest of the company including reducing the stranded costs, replacing operating and technology capabilities lost through the sale of a 55% interest in Financial & Risk, and investments to better position Thomson Reuters for the future. |
We expect stranded costs will gradually decline to approximately $100 million in 2019 and to $50 million or less by the end of 2020. We expect to begin spending to reposition the business in the second quarter of 2018. In 2019, we expect to spend an additional $250 million to $300 million to separate and reposition the remaining business, for a total of $500 million to $600 million over 2018 and 2019.
Page 19
We expect depreciation and amortization of computer software to be between $500 million and $525 million, capital expenditures to approximate 10% of revenues, and our 2018 effective tax rate to be between 14% and 16%, assuming no material changes in current tax laws or treaties to which we are subject. Our expectation for the full-year tax rate reflects the impact of anticipated spending in the second half of 2018 to separate and reposition our business in connection with the disposition of a 55% interest in the Financial & Risk business.
Additionally, interest expense for the first half of the year is expected to be $165 million. We are unable to provide an outlook for interest expense in the second half of the year, as the closing date of the proposed Financial & Risk transaction is not known at this time. The date of the closing impacts the timing of our anticipated debt repayments. We intend to provide an outlook for interest expense in the second half of the year at a later date.
Our Outlook contains various non-IFRS financial measures. For Outlook purposes only, we are unable to reconcile these non-IFRS measures to the most comparable IFRS measures because we cannot predict, with reasonable certainty, the 2018 impact of changes in foreign exchange rates which impact (i) the translation of our results reported at average foreign currency rates for the year and (ii) other finance income or expense related to foreign exchange contracts and intercompany financing arrangements. Additionally, we cannot reasonably predict the occurrence or amount of other operating gains and losses, which generally arise from business transactions we do not anticipate.
As of May 10, 2018, Woodbridge beneficially owned approximately 63% of our shares.
There were no new significant related party transactions during the first quarter of 2018. Please refer to the “Related Party Transactions” section of our 2017 annual management’s discussion and analysis, which is contained in our 2017 annual report, as well as note 29 of our 2017 annual consolidated financial statements for information regarding related party transactions.
Transactions with Woodbridge
In April 2018, we sold a Canadian wholly owned subsidiary to a company affiliated with Woodbridge for $16 million. Consistent with prior transactions, these proceeds will be recorded as a gain in “Other operating (losses) gains, net” within the consolidated income statement in the second quarter of 2018.
Share repurchases
In May 2018, the company announced that it may buy back up to $500 million of its shares prior to the closing of the proposed Financial & Risk transaction under its NCIB. Any repurchases under the NCIB prior to the closing of the proposed Financial & Risk transaction will reduce the size of the contemplated post-closing substantial issuer bid/tender offer made to all shareholders, which may be at a premium to the then-current market price of the company’s shares. Decisions regarding any future repurchases will depend on the timing of the closing of the proposed strategic partnership transaction and other factors, such as market conditions, share price and other opportunities to invest capital for growth.
Changes in Accounting Policies
Please refer to the “Changes in Accounting Policies” section of our 2017 annual management’s discussion and analysis, which is contained in our 2017 annual report, as well as notes 1 and 2 of our consolidated interim financial statements for the three months ended March 31, 2018, for information regarding changes in accounting policies.
Critical Accounting Estimates and Judgments
The preparation of financial statements requires management to make estimates and judgments about the future. Estimates and judgments are continually evaluated and are based on historical experience and other factors, including expectations of future events that are believed to be reasonable under the circumstances. Please refer to the “Critical Accounting Estimates and Judgments” section of our 2017 annual management’s discussion and analysis, which is contained in our 2017 annual report, for additional information, as well as note 3 of our consolidated interim financial statements for the three months ended March 31, 2018, for information regarding changes on our critical accounting judgments.
Page 20
Disclosure controls and procedures
Our Chief Executive Officer and Chief Financial Officer, after evaluating the effectiveness of our disclosure controls and procedures (as defined in applicable U.S. and Canadian securities law) as of the end of the period covered by this management’s discussion and analysis, have concluded that our disclosure controls and procedures were effective to ensure that all information that we are required to disclose in reports that we file or furnish under the U.S. Securities Exchange Act and applicable Canadian securities law is (i) recorded, processed, summarized and reported within the time periods specified in the rules and forms of the SEC and Canadian securities regulatory authorities and (ii) accumulated and communicated to our management, including our Chief Executive Officer and Chief Financial Officer, to allow timely decisions regarding required disclosure.
Internal control over financial reporting
Our management is responsible for establishing and maintaining adequate internal control over financial reporting to provide reasonable assurance regarding the reliability of financial reporting and the preparation of financial statements for external purposes in accordance with IFRS.
We are engaged in the following long-term efficiency initiative which impacts our financial reporting:
| ● | We are enhancing our order-to-cash (OTC) applications and related workflow processes in phases over multiple years. Key elements of the OTC solutions are order management, billing, cash management and collections functionality. We expect to reduce the number of applications and to streamline and automate processes across our organization through this initiative. |
As we are implementing this initiative in phases over an extended period, the nature and extent of activity will vary by quarter. In certain quarters, we may have limited or no activity.
The initiative could result in material changes to our internal control over financial reporting depending on the nature and volume of work completed as we will continue to modify the design and documentation of the related internal control processes and procedures, as necessary. Except as described above, there was no change in our internal control over financial reporting during the first quarter of 2018 that materially affected, or is reasonably likely to materially affect, our internal control over financial reporting.
Additionally, when the Financial & Risk strategic partnership transaction closes, the company will separate its Financial & Risk business from the rest of its business. The separation is expected to include the transfer of a significant number of employees who perform accounting and reporting functions. While management does not anticipate material changes in key controls over our financial reporting processes, a number of key controls will be performed under transition service arrangements between Thomson Reuters and the Financial & Risk strategic partnership.
Share capital
As of May 10, 2018, we had outstanding 711,672,758 common shares, 6,000,000 Series II preference shares, 9,150,427 stock options and a total of 4,326,237 time-based restricted share units and performance restricted share units. We have also issued a Thomson Reuters Founders Share which enables Thomson Reuters Founders Share Company to exercise extraordinary voting power to safeguard the Thomson Reuters Trust Principles.
Public securities filings and regulatory announcements
You may access other information about our company, including our 2017 annual report (which contains information required in an annual information form) and our other disclosure documents, reports, statements or other information that we file with the Canadian securities regulatory authorities through SEDAR at www.sedar.com and in the United States with the SEC at www.sec.gov. These filings also include additional information about our proposed Financial & Risk strategic partnership.
Page 21
Cautionary note concerning factors that may affect future results
Certain statements in this management’s discussion and analysis are forward-looking, including, but not limited to, statements about the proposed Financial & Risk strategic partnership, the anticipated timing of the closing, and the expected uses of proceeds from the transaction, our 2018 expectations in the “Overview” and “Executive Summary” sections and statements regarding our Legal print business. The words “expect”, “believe”, “target” and “will” and similar expressions identify forward-looking statements. Forward-looking statements are subject to a number of risks and uncertainties that could cause actual results or events to differ materially from current expectations. These forward-looking statements are based on certain assumptions and reflect our company’s current expectations. As a result, forward-looking statements are subject to a number of risks and uncertainties that could cause actual results or events to differ materially from current expectations. Certain factors that could cause actual results or events to differ materially from current expectations are discussed in the “Outlook” section above. Additional factors are discussed in the “Risk Factors” section of our 2017 annual report and in materials that we from time to time file with, or furnish to, the Canadian securities regulatory authorities and the U.S. Securities and Exchange Commission. There is no assurance that any forward-looking statement will materialize. Our Outlook is provided for the purpose of providing information about current expectations for 2018. This information may not be appropriate for other purposes. You are cautioned not to place undue reliance on forward-looking statements, which reflect our expectations only as of the date of this management’s discussion and analysis. Except as may be required by applicable law, we disclaim any obligation to update or revise any forward-looking statements.
Page 22
Non-IFRS Financial Measures
We use non-IFRS financial measures as supplemental indicators of our operating performance and financial position. Additionally, we use non-IFRS measures as performance metrics as the basis for management incentive programs. These measures do not have any standardized meaning prescribed by IFRS and therefore are unlikely to be comparable to the calculation of similar measures used by other companies. Except for free cash flow, all our non-IFRS measures exclude the results of our Financial & Risk business, which was reported as a discontinued operation.
The following table sets forth our non-IFRS financial measures, including an explanation of why we believe they are useful measures of our performance. Reconciliations for the most directly comparable IFRS measure are reflected in our management’s discussion and analysis.
|
How We Define It |
Why We Use It and Why It Is Useful to Investors |
Most Directly
Comparable
| ||
|
Segment adjusted EBITDA, consolidated adjusted EBITDA and the related margins
| ||||
|
Segment adjusted EBITDA represents earnings from continuing operations, or for Financial & Risk, (loss) earnings from discontinued operations, before tax expense or benefit, net interest expense, other finance costs or income, depreciation, amortization of software and other identifiable intangible assets, our share of post-tax earnings or losses in equity method investments, other operating gains and losses, certain asset impairment charges, fair value adjustments and corporate related items.
Consolidated adjusted EBITDA is comprised of segment adjusted EBITDA from each reportable segment and Corporate.
The related margins are expressed as a percentage of revenues.
|
Provides a consistent basis to evaluate operating profitability and performance trends by excluding items that we do not consider to be controllable activities for this purpose.
Represents a measure commonly reported and widely used by investors as a valuation metric. Additionally, this measure is used to assess our ability to incur and service debt. |
Earnings from continuing operations | ||
|
Adjusted EBITDA less capital expenditures and the related margin and the related margin
| ||||
|
Adjusted EBITDA less capital expenditures, less proceeds from disposals. The related margin is expressed as a percentage of revenues. |
Provides a basis for evaluating the operating profitability and capital intensity of a business in a single measure. This measure captures investments regardless of whether they are expensed or capitalized.
|
Earnings from continuing operations | ||
|
Adjusted earnings and adjusted EPS
| ||||
|
Net earnings and per share: ● excluding the post-tax impacts of fair value adjustments, amortization of other identifiable intangible assets, other operating gains and losses, certain impairment charges, other net finance costs or income, our share of post-tax earnings or losses in equity method investments, discontinued operations and other items affecting comparability. We calculate the post-tax amount of each item excluded from adjusted earnings based on the specific tax rules and tax rates associated with the nature and jurisdiction of each item. ● We also deduct dividends declared on preference shares.
Adjusted EPS is calculated using diluted weighted-average shares.
|
Provides a more comparable basis to analyze earnings and is also a measure commonly used by shareholders to measure our performance.
|
Net earnings and diluted earnings | ||
Page 23
|
How We Define It |
Why We Use It and Why It Is Useful to Investors |
Most Directly
Comparable
| ||
|
Adjusted earnings and adjusted EPS (continued)
| ||||
|
In interim periods, we also adjust our reported earnings and earnings per share to reflect a normalized effective tax rate. Specifically, the normalized effective rate is computed as the estimated full-year effective tax rate applied to pre-tax adjusted earnings of the interim period. The reported effective tax rate is based on separate annual effective income tax rates for each taxing jurisdiction that are applied to each interim period’s pre-tax income.
|
Because the geographical mix of pre-tax profits and losses in interim periods may be different from that for the full year, our effective tax rate computed in accordance with IFRS may be more volatile by quarter. Therefore, we believe that using the expected full-year effective tax rate provides more comparability among interim periods. The adjustment to normalize the effective tax rate reallocates estimated full-year income taxes between interim periods, but has no effect on full year tax expense or on cash taxes paid.
|
|||
|
Net debt
| ||||
|
Total indebtedness, including the associated fair value of hedging instruments, but excluding the associated unamortized transaction costs and premiums or discounts and the interest-related fair value component of hedging instruments, less cash and cash equivalents. |
Provides a commonly used measure of a company’s leverage.
Given that we hedge some of our debt to reduce risk, we include hedging instruments as we believe it provides a better measure of the total obligation associated with our outstanding debt. However, because we intend to hold our debt and related hedges to maturity, we do not consider the interest components of the associated fair value of hedges in our measurements. We reduce gross indebtedness by cash and cash equivalents.
|
Total debt (current indebtedness | ||
|
Free cash flow (includes free cash flow from continuing and discontinued operations)
| ||||
|
Net cash provided by (used in) operating activities, and other investing activities, less capital expenditures, dividends paid on our preference shares, and dividends paid to non-controlling interests from discontinued operations.
|
Helps assess our ability, over the long term, to create value for our shareholders as it represents cash available to repay debt, pay common dividends and fund share repurchases and new acquisitions.
|
Net cash provided by (used
in) | ||
|
Changes before the impact of foreign currency or at “constant currency”
| ||||
|
Applicable measures where changes are reported before the impact of foreign currency or at “constant currency”
IFRS Measures: ● Revenues ● Operating expenses
Non-IFRS Measures: ● Adjusted EBITDA and adjusted EBITDA margin ● Adjusted EPS |
Provides better comparability of business trends from period to period.
Our reporting currency is the U.S. dollar. However, we conduct a significant amount of our activities in currencies other than the U.S. dollar. We measure our performance before the impact of foreign currency (or at “constant currency”), which means that we apply the same foreign currency exchange rates for the current and equivalent prior period. To calculate the foreign currency impact between periods, we convert the current and equivalent prior period’s local currency results using the same foreign currency exchange rate.
|
For each
non-IFRS measure, refer to | ||
Page 24
Appendix B
This appendix provides reconciliations that are not presented elsewhere in this management’s discussion and analysis for certain non-IFRS measures to the most directly comparable IFRS measure for the three months ended March 31, 2018 and 2017.
Reconciliation of earnings from continuing operations to adjusted EBITDA and adjusted EBITDA less capital expenditures
| Three months ended March 31, | ||||||||||||
| (millions of U.S. dollars, except margins) | 2018 | 2017 | Change | |||||||||
| Earnings from continuing operations |
172 | 145 | 19% | |||||||||
| Adjustments to remove: |
||||||||||||
| Tax expense |
27 | 11 | ||||||||||
| Other finance (income) costs |
(7) | 28 | ||||||||||
| Net interest expense |
78 | 92 | ||||||||||
| Amortization of other identifiable intangible assets |
29 | 35 | ||||||||||
| Amortization of computer software |
98 | 96 | ||||||||||
| Depreciation |
30 | 28 | ||||||||||
| EBITDA |
427 | 435 | ||||||||||
| Adjustments to remove: |
||||||||||||
| Share of post-tax earnings in equity method investments |
(2) | (2) | ||||||||||
| Other operating losses (gains), net |
2 | (13) | ||||||||||
| Fair value adjustments |
3 | (5) | ||||||||||
| Adjusted EBITDA |
430 | 415 | 4% | |||||||||
| Deduct: capital expenditures, less proceeds from disposals |
(179) | (108) | ||||||||||
| Adjusted EBITDA less capital expenditures |
251 | 307 | (18%) | |||||||||
| Adjusted EBITDA margin |
31.2% | 31.2% | - | |||||||||
| Adjusted EBITDA less capital expenditures margin |
18.2% | 23.1% | (490)bp | |||||||||
Page 25
Reconciliation of changes in segment and consolidated revenues, adjusted EBITDA and the related margin, and consolidated operating expenses and adjusted EPS, excluding the effects of foreign currency
| Three months ended March 31, | ||||||||||||||||||||
| Change | ||||||||||||||||||||
| (millions of U.S. dollars) | 2018 | 2017 | Total | Foreign Currency |
Constant Currency |
|||||||||||||||
| Revenues |
||||||||||||||||||||
| Legal |
872 | 841 | 4% | 2% | 2% | |||||||||||||||
| Tax & Accounting |
437 | 417 | 5% | - | 5% | |||||||||||||||
| Reuters News |
72 | 74 | (3%) | 4% | (7%) | |||||||||||||||
| Eliminations |
(2) | (1) | ||||||||||||||||||
| Consolidated revenues |
1,379 | 1,331 | 4% | 1% | 3% | |||||||||||||||
| Three months ended March 31, | ||||||||||||||||||||
| Change | ||||||||||||||||||||
| (millions of U.S. dollars, except margins) | 2018 | 2017 | Total | Foreign Currency |
Constant Currency |
|||||||||||||||
| Adjusted EBITDA |
||||||||||||||||||||
| Legal |
319 | 314 | 2% | 1% | 1% | |||||||||||||||
| Tax & Accounting |
147 | 141 | 4% | (1%) | 5% | |||||||||||||||
| Reuters News |
8 | 13 | (38%) | - | (38%) | |||||||||||||||
| Corporate |
(44) | (53) | n/a | n/a | n/a | |||||||||||||||
| Consolidated adjusted EBITDA |
430 | 415 | 4% | 1% | 3% | |||||||||||||||
| Adjusted EBITDA Margin |
||||||||||||||||||||
| Legal |
36.6% | 37.3% | (70)bp | (20)bp | (50)bp | |||||||||||||||
| Tax & Accounting |
33.6% | 33.8% | (20)bp | (30)bp | 10bp | |||||||||||||||
| Reuters News |
11.1% | 17.6% | (650)bp | (60)bp | (590)bp | |||||||||||||||
| Corporate |
n/a | n/a | n/a | n/a | n/a | |||||||||||||||
| Consolidated adjusted EBITDA margin |
31.2% | 31.2% | - | - | - | |||||||||||||||
| Three months ended March 31, | ||||||||||||||||||||
| Change | ||||||||||||||||||||
| (millions of U.S. dollars, except per share amounts) | 2018 | 2017 | Total | Foreign Currency |
Constant Currency |
|||||||||||||||
| Consolidated operating expenses |
952 | 911 | 5% | 2% | 3% | |||||||||||||||
| Consolidated adjusted EPS |
$0.28 | $0.25 | 12% | - | 12% | |||||||||||||||
Page 26
Reconciliation of earnings from discontinued operations to Financial & Risk adjusted EBITDA
| Three months ended March 31, | ||||||||||||
| (millions of U.S. dollars, except margins) | 2018 | 2017 | Change | |||||||||
| Earnings from discontinued operations |
(483) | 169 | n/m | |||||||||
| Adjustments to remove: |
||||||||||||
| Tax expense (benefit) |
868 | (2) | ||||||||||
| Other finance costs (income) |
5 | (1) | ||||||||||
| Net interest expense |
4 | 1 | ||||||||||
| Amortization of other identifiable intangible assets |
28 | 84 | ||||||||||
| Amortization of computer software |
30 | 84 | ||||||||||
| Depreciation |
14 | 44 | ||||||||||
| EBITDA |
466 | 379 | ||||||||||
| Adjustments to remove: |
||||||||||||
| Other operating losses, net |
41 | 9 | ||||||||||
| Fair value adjustments |
18 | 70 | ||||||||||
| IP & Science from discontinued operations |
1 | 3 | ||||||||||
| Financial & Risk discontinued operations adjusted EBITDA |
526 | 461 | 14% | |||||||||
| Adjusted EBITDA margin |
33.2% | 31.0% | 220bp | |||||||||
Reconciliation of operating cash flows from discontinued operations to Financial & Risk free cash flow
| Three months ended March 31, | ||||||||
| (millions of U.S. dollars) | 2018 | 2017 | ||||||
| Operating cash flows from discontinued operations |
210 | 29 | ||||||
| Remove: Operating cash flows - IP & Science discontinued operations |
- | 41 | ||||||
| Capital expenditures from discontinued operations |
(108) | (105) | ||||||
| Dividends paid to non-controlling interests from discontinued operations |
(11) | (9) | ||||||
| Free cash flow - Financial & Risk discontinued operations |
91 | (44) | ||||||
Page 27
Appendix C
Supplemental Financial Information (unaudited)
The following supplemental financial information provides revised 2017 full-year and quarterly business segment information excluding the Financial & Risk business, which was classified as a discontinued operation beginning in the first quarter of 2018. The information provided illustrates our business on a continuing operations basis. As it includes certain estimates, periods subsequent to March 31, 2017 are subject to revision until the proposed Financial & Risk transaction is completed.
Revised Business Segment Information (Excluding the Financial & Risk Segment)
| Year ended December 31, 2017 |
Adjustments | Year ended December 31, 2017 |
||||||||||||||||||
| (millions of U.S. dollars, except for per share amounts) | Previously Reported |
Remove Financial & Risk Segment Results |
Add Back Retained Businesses(3) |
Other Adjustments(4) |
Revised Excluding Financial & Risk |
|||||||||||||||
| Revenues |
||||||||||||||||||||
| Financial & Risk |
6,112 | (6,112) | - | - | - | |||||||||||||||
| Legal |
3,390 | - | 69 | - | 3,459 | |||||||||||||||
| Tax & Accounting |
1,551 | - | - | - | 1,551 | |||||||||||||||
| Reuters News(1) |
296 | - | - | - | 296 | |||||||||||||||
| Eliminations |
(16) | 7 | - | - | (9) | |||||||||||||||
| Revenues from continuing operations |
11,333 | (6,105) | 69 | - | 5,297 | |||||||||||||||
| Adjusted EBITDA(2) |
||||||||||||||||||||
| Financial & Risk |
1,916 | (1,916) | - | - | - | |||||||||||||||
| Legal |
1,279 | - | 28 | - | 1,307 | |||||||||||||||
| Tax & Accounting |
495 | - | - | - | 495 | |||||||||||||||
| Reuters News(1) |
27 | - | - | - | 27 | |||||||||||||||
| Corporate |
(280) | - | - | 36 | (244) | |||||||||||||||
| Consolidated adjusted EBITDA |
3,437 | (1,916) | 28 | 36 | 1,585 | |||||||||||||||
| Adjusted earnings(2) |
||||||||||||||||||||
| Adjusted EBITDA |
3,437 | (1,916) | 28 | 36 | 1,585 | |||||||||||||||
| Depreciation and amortization of computer software |
(995) | 581 | (10) | (72) | (496) | |||||||||||||||
| Adjustments: |
||||||||||||||||||||
| Interest |
(362) | - | - | 4 | (358) | |||||||||||||||
| Tax |
(205) | 121 | (2) | 3 | (83) | |||||||||||||||
| Non-controlling interests |
(64) | - | - | 64 | - | |||||||||||||||
| Dividends declared on preference shares |
(2) | - | - | - | (2) | |||||||||||||||
| Adjusted earnings |
1,809 | (1,214) | 16 | 35 | 646 | |||||||||||||||
| Adjusted EPS(2) |
$ | 2.51 | (1.68) | 0.02 | 0.05 | $ | 0.90 | |||||||||||||
| (1) | Effective January 1, 2018, Reuters News is a reportable segment. |
| (2) | Refer to Appendix A for a definition of our non-IFRS measures. Refer to “Appendix B” of our management’s discussion and analysis in our 2017 annual report for a reconciliation of these non-IFRS financial measure to the most directly comparable IFRS measure. |
| (3) | Represents the Regulatory Intelligence and Compliance Learning businesses that will be retained by our Legal segment following the closing of the proposed Financial & Risk transaction. |
| (4) | Other adjustments include the following: |
| ● | Adjusted EBITDA contains costs primarily for real estate optimization that relate to properties to be transferred with the Financial & Risk business. |
| ● | Depreciation and amortization of computer software relates to assets that will not be transferred with the Financial & Risk business. |
| ● | Non-controlling interests relates to third party shareholdings in Tradeweb that will be transferred with the Financial & Risk business. |
Page 28
Revised Business Segment Information (Excluding the Financial & Risk Segment) (continued)
| 2017 | ||||||||||||||||||||
| (millions of U.S. dollars, except per share amounts and margins) | First Quarter |
Second Quarter |
Third Quarter |
Fourth Quarter |
Year ended December 31, |
|||||||||||||||
| Revenues |
||||||||||||||||||||
| Legal |
841 | 858 | 860 | 900 | 3,459 | |||||||||||||||
| Tax & Accounting |
417 | 350 | 341 | 443 | 1,551 | |||||||||||||||
| Reuters News |
74 | 74 | 73 | 75 | 296 | |||||||||||||||
| Eliminations |
(1) | (2) | (2) | (4) | (9) | |||||||||||||||
| Revenues from continuing operations |
1,331 | 1,280 | 1,272 | 1,414 | 5,297 | |||||||||||||||
| Adjusted EBITDA(1) |
||||||||||||||||||||
| Legal |
314 | 325 | 345 | 323 | 1,307 | |||||||||||||||
| Tax & Accounting |
141 | 103 | 95 | 156 | 495 | |||||||||||||||
| Reuters News |
13 | 9 | 7 | (2) | 27 | |||||||||||||||
| Corporate |
(53) | (57) | (60) | (74) | (244) | |||||||||||||||
| Consolidated adjusted EBITDA |
415 | 380 | 387 | 403 | 1,585 | |||||||||||||||
| Adjusted earnings(1) |
||||||||||||||||||||
| Adjusted EBITDA |
415 | 380 | 387 | 403 | 1,585 | |||||||||||||||
| Depreciation and amortization of computer software |
(124) | (127) | (117) | (128) | (496) | |||||||||||||||
| Adjustments: |
||||||||||||||||||||
| Interest |
(92) | (89) | (89) | (88) | (358) | |||||||||||||||
| Tax |
(18) | (24) | (1) | (40) | (83) | |||||||||||||||
| Dividends declared on preference shares |
(1) | - | (1) | - | (2) | |||||||||||||||
| Adjusted earnings |
180 | 140 | 179 | 147 | 646 | |||||||||||||||
| Adjusted EPS(1) |
$0.25 | $0.19 | $0.25 | $0.21 | $0.90 | |||||||||||||||
| Adjusted EBITDA margin(1) |
||||||||||||||||||||
| Legal |
37.3% | 37.9% | 40.1% | 35.9% | 37.8% | |||||||||||||||
| Tax & Accounting |
33.8% | 29.4% | 27.9% | 35.2% | 31.9% | |||||||||||||||
| Reuters News |
17.6% | 12.2% | 9.6% | n/m | 9.1% | |||||||||||||||
| Corporate |
n/a | n/a | n/a | n/a | n/a | |||||||||||||||
| Consolidated adjusted EBITDA margin |
31.2% | 29.7% | 30.4% | 28.5% | 29.9% | |||||||||||||||
| (1) | Refer to Appendix A for a definition of our non-IFRS measures. |
Page 29
The following supplemental information provides our consolidated income statement and segment information for the years ending December 31, 2017 and 2016, as previously reported and as revised to reflect our Financial & Risk business as a discontinued operation. This information includes certain estimates and is subject to revision until the proposed Financial & Risk transaction is completed.
Consolidated Income Statement
| Year ended December 31, 2017 | Year ended December 31, 2016 | |||||||||||||||||||||||
| (millions of U.S. dollars, except per share amounts) | Previously Reported |
Adjustments(1) | Revised | Previously Reported |
Adjustments(1) | Revised | ||||||||||||||||||
| CONTINUING OPERATIONS |
||||||||||||||||||||||||
| Revenues |
11,333 | (6,036) | 5,297 | 11,166 | (5,983) | 5,183 | ||||||||||||||||||
| Operating expenses |
(8,079) | 4,372 | (3,707) | (8,232) | 4,391 | (3,841) | ||||||||||||||||||
| Depreciation |
(296) | 173 | (123) | (313) | 168 | (145) | ||||||||||||||||||
| Amortization of computer software |
(699) | 326 | (373) | (711) | 337 | (374) | ||||||||||||||||||
| Amortization of other identifiable intangible assets |
(468) | 331 | (137) | (528) | 342 | (186) | ||||||||||||||||||
| Other operating (losses) gains, net |
(36) | 84 | 48 | 8 | 28 | 36 | ||||||||||||||||||
| Operating profit |
1,755 | (750) | 1,005 | 1,390 | (717) | 673 | ||||||||||||||||||
| Finance costs, net |
||||||||||||||||||||||||
| Net interest expense |
(362) | 4 | (358) | (403) | (1) | (404) | ||||||||||||||||||
| Other finance (costs) income |
(203) | 33 | (170) | 50 | 23 | 73 | ||||||||||||||||||
| Income before tax and equity method investments |
1,190 | (713) | 477 | 1,037 | (695) | 342 | ||||||||||||||||||
| Share of post-tax (losses) earnings in equity method investments |
(2) | (2) | (4) | 4 | (2) | 2 | ||||||||||||||||||
| Tax benefit (expense) |
274 | (136) | 138 | 15 | (23) | (8) | ||||||||||||||||||
| Earnings from continuing operations |
1,462 | (851) | 611 | 1,056 | (720) | 336 | ||||||||||||||||||
| (Loss) earnings from discontinued operations, net of tax |
(3) | 851 | 848 | 2,093 | 720 | 2,813 | ||||||||||||||||||
| Net earnings |
1,459 | — | 1,459 | 3,149 | — | 3,149 | ||||||||||||||||||
| Earnings attributable to: |
||||||||||||||||||||||||
| Common shareholders |
1,395 | — | 1,395 | 3,098 | — | 3,098 | ||||||||||||||||||
| Non-controlling interests |
64 | — | 64 | 51 | — | 51 | ||||||||||||||||||
| Earnings per share |
||||||||||||||||||||||||
| Basic earnings per share |
||||||||||||||||||||||||
| From continuing operations |
$1.94 | $(1.09) | $0.85 | $1.34 | $(0.89) | $ | 0.45 | |||||||||||||||||
| From discontinued operations |
— | 1.09 | 1.09 | 2.80 | 0.89 | 3.69 | ||||||||||||||||||
| Basic earnings per share |
$1.94 | — | $1.94 | $4.14 | — | $4.14 | ||||||||||||||||||
| Diluted earnings per share |
||||||||||||||||||||||||
| From continuing operations |
$1.94 | $(1.09) | $0.85 | $1.34 | $(0.89) | $ | 0.45 | |||||||||||||||||
| From discontinued operations |
— | 1.09 | 1.09 | 2.79 | 0.89 | 3.68 | ||||||||||||||||||
| Diluted earnings per share |
$1.94 | — | $1.94 | $4.13 | — | $4.13 | ||||||||||||||||||
| (1) | Adjustments include the reclassification of our Financial & Risk business to discontinued operations, except for the Regulatory Intelligence and Compliance Learning businesses that will be retained by our Legal segment following the closing of the proposed Financial & Risk transaction. |
Page 30
Segment Information
| Year ended December 31, 2017 | Year ended December 31, 2016 | |||||||||||||||||||||||
| (millions of U.S. dollars) | Previously Reported |
Adjustments(1) | Revised | Previously Reported |
Adjustments(1) | Revised | ||||||||||||||||||
| Revenues |
||||||||||||||||||||||||
| Financial & Risk |
6,112 | (6,112) | — | 6,057 | (6,057) | — | ||||||||||||||||||
| Legal |
3,390 | 69 | 3,459 | 3,367 | 69 | 3,436 | ||||||||||||||||||
| Tax & Accounting |
1,551 | — | 1,551 | 1,452 | — | 1,452 | ||||||||||||||||||
| Reuters News |
296 | — | 296 | 304 | — | 304 | ||||||||||||||||||
| Eliminations |
(16) | 7 | (9) | (14) | 5 | (9) | ||||||||||||||||||
| Consolidated revenues |
11,333 | (6,036) | 5,297 | 11,166 | (5,983) | 5,183 | ||||||||||||||||||
| Adjusted EBITDA |
||||||||||||||||||||||||
| Financial & Risk |
1,916 | (1,916) | — | 1,629 | (1,629) | — | ||||||||||||||||||
| Legal |
1,279 | 28 | 1,307 | 1,232 | 27 | 1,259 | ||||||||||||||||||
| Tax & Accounting |
495 | — | 495 | 414 | — | 414 | ||||||||||||||||||
| Reuters News |
27 | — | 27 | 15 | — | 15 | ||||||||||||||||||
| Corporate |
(280) | 36 | (244) | (336) | 15 | (321) | ||||||||||||||||||
| Adjusted EBITDA |
3,437 | (1,852) | 1,585 | 2,954 | (1,587) | 1,367 | ||||||||||||||||||
| Fair value adjustments |
(183) | 188 | 5 | (20) | (5) | (25) | ||||||||||||||||||
| Depreciation |
(296) | 173 | (123) | (313) | 168 | (145) | ||||||||||||||||||
| Amortization of computer software |
(699) | 326 | (373) | (711) | 337 | (374) | ||||||||||||||||||
| Amortization of other identifiable intangible assets |
(468) | 331 | (137) | (528) | 342 | (186) | ||||||||||||||||||
| Other operating (losses) gains, net |
(36) | 84 | 48 | 8 | 28 | 36 | ||||||||||||||||||
| Consolidated operating profit |
1,755 | (750) | 1,005 | 1,390 | (717) | 673 | ||||||||||||||||||
| Net interest expense |
(362) | 4 | (358) | (403) | (1) | (404) | ||||||||||||||||||
| Other finance (costs) income |
(203) | 33 | (170) | 50 | 23 | 73 | ||||||||||||||||||
| Share of post-tax (losses) earnings in equity method investments |
(2) | (2) | (4) | 4 | (2) | 2 | ||||||||||||||||||
| Tax benefit (expense) |
274 | (136) | 138 | 15 | (23) | (8) | ||||||||||||||||||
| Earnings from continuing operations |
1,462 | (851) | 611 | 1,056 | (720) | 336 | ||||||||||||||||||
| (1) | Adjustments relate to the reclassification of Financial & Risk to discontinued operations, including the reclassification of the Regulatory Intelligence and Compliance Learning businesses from Financial & Risk to our Legal segment, where it will be retained following the closing of the proposed Financial & Risk transaction. |
Appendix D
Depreciation and amortization of computer software by segment
| Three months ended March 31, | ||||||||
| (millions of U.S. dollars) | 2018 | 2017 | ||||||
| Legal |
63 | 64 | ||||||
| Tax & Accounting |
37 | 32 | ||||||
| Reuters News |
4 | 4 | ||||||
| Corporate |
24 | 24 | ||||||
| Total |
128 | 124 | ||||||
Page 31
Appendix E
Quarterly information (unaudited)
The following table presents a summary of our consolidated operating results for the eight most recent quarters.
| Quarters ended | ||||||||||||||||||||||||||||||||
| (millions of U.S. dollars, except per share amounts) |
March 31, 2018 |
December 31, 2017 |
September 30, 2017 |
June 30, 2017 |
March 31, 2017 |
December 31, 2016 |
September 30, 2016 |
June 30, 2016 |
||||||||||||||||||||||||
| Revenues |
1,379 | 1,414 | 1,272 | 1,280 | 1,331 | 1,372 | 1,247 | 1,264 | ||||||||||||||||||||||||
| Operating profit |
268 | 242 | 271 | 218 | 274 | 181 | 182 | 156 | ||||||||||||||||||||||||
| Earnings from continuing operations |
172 | 292 | 127 | 47 | 145 | 181 | 73 | 49 | ||||||||||||||||||||||||
| (Loss) earnings from discontinued operations, net of tax |
(483) | 299 | 221 | 159 | 169 | 2,060 | 213 | 301 | ||||||||||||||||||||||||
| Net (loss) earnings |
(311) | 591 | 348 | 206 | 314 | 2,241 | 286 | 350 | ||||||||||||||||||||||||
| Loss (earnings) attributable to common shareholders |
(339) | 576 | 330 | 192 | 297 | 2,226 | 273 | 337 | ||||||||||||||||||||||||
| Basic (loss) earnings per share |
||||||||||||||||||||||||||||||||
| From continuing operations |
$ | 0.24 | $ | 0.41 | $ | 0.18 | $ | 0.07 | $ | 0.20 | $ | 0.25 | $ | 0.10 | $ | 0.07 | ||||||||||||||||
| From discontinued operations |
(0.72) | 0.40 | 0.28 | 0.20 | 0.21 | 2.79 | 0.27 | 0.38 | ||||||||||||||||||||||||
| $ | (0.48) | $ | 0.81 | $ | 0.46 | $ | 0.27 | $ | 0.41 | $ | 3.04 | $ | 0.37 | $ | 0.45 | |||||||||||||||||
| Diluted (loss) earnings per share |
||||||||||||||||||||||||||||||||
| From continuing operations |
$ | 0.24 | $ | 0.41 | $ | 0.18 | $ | 0.07 | $ | 0.20 | $ | 0.25 | $ | 0.10 | $ | 0.07 | ||||||||||||||||
| From discontinued operations |
(0.72) | 0.40 | 0.28 | 0.20 | 0.21 | 2.78 | 0.26 | 0.38 | ||||||||||||||||||||||||
| $ | (0.48) | $ | 0.81 | $ | 0.46 | $ | 0.27 | $ | 0.41 | $ | 3.03 | $ | 0.36 | $ | 0.45 | |||||||||||||||||
Revenues - Our revenues do not tend to be significantly impacted by seasonality as we record a large portion of our revenues ratably over a contract term. However, our revenues in the fourth quarter tend to be slightly higher than in each of the first three quarters of the year due to the release of certain print-based offerings in our Legal segment and higher revenues from certain tax products in our Tax & Accounting segment. Foreign currency had a negative impact on our revenues throughout most of the eight quarter period.
Operating profit - Similarly, our operating profit does not tend to be significantly impacted by seasonality. A majority of our operating expenses are fixed. As a result, when our revenues increase, we become more profitable, and when our revenues decline, we become less profitable. Additionally, our operating profit is impacted by timing of our investment spending in our businesses, including those to improve customer experience, as well as gains or losses on the sales of certain equity investments.
Net (loss) earnings - The net loss in the first quarter of 2018 was due to an $844 million deferred tax charge associated with the proposed sale of a 55% interest in our Financial & Risk business, which is reflected in (Loss) earnings from discontinued operations, net of tax. The increase in net earnings in the fourth quarter of 2017, compared to the first three quarters of the year was due to $304 million of tax benefits resulting from the enactment of the Tax Act. The fourth quarter of 2016 included a $2.0 billion gain on the sale of our IP & Science business.
Page 32